This application applies the Discrete Fourier Transform (DFT) or its inverse (IDFT) to a set of real or complex valued input samples and allows the result to be plotted and evaluated.
There are two ways to define the input samples.
Samples mode allows the user to enter a value or mathematical expression for each individual input sample.
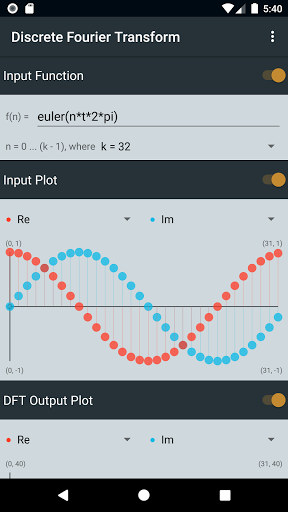
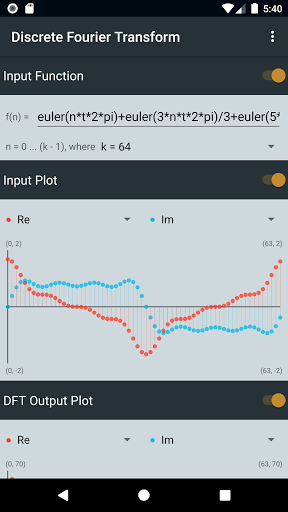
Function mode allows the user to enter a function which is then used to generate input samples.
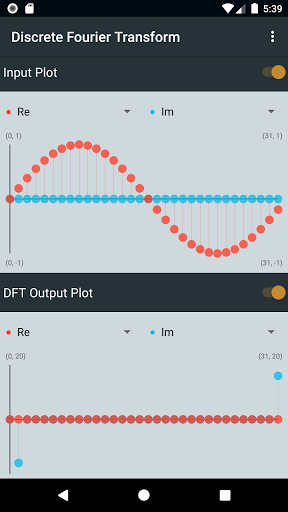
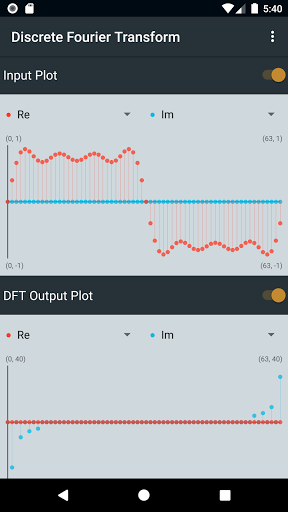
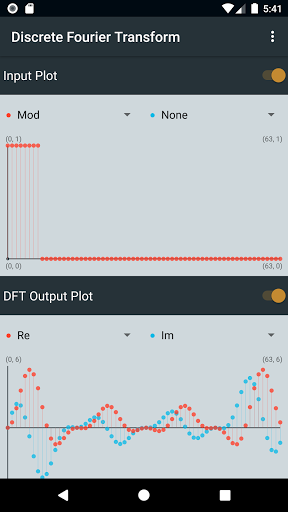
Input and output samples are displayed graphically on plots, each of which can show two sets of data. Each set can contain one of the following types of sample value: real, imaginary, modulus or argument. The second set can be hidden when it is not required. Vertical scales are determined automatically based on the range of values being plotted. The axes and origin will only be displayed when they fall within the range of values covered by the plot. When shown, they will appear in black. Finally, note that the labels at each corner of a plot give the value at that corner. Be careful not to assume that these are labelling a point that has been plotted near one of the corners.
An evaluation area is provided to allow the transformed samples to be studied in more detail by focusing on an individual output sample.
We hope you enjoy using this application.
Data safety
Safety starts with understanding how developers
collect and share your data. Data privacy and security practices may vary based
on your use, region, and age. The developer provided this information and may
update it over time.